Search

Beyond The Autobahn

Chris Ziemann's impressions of urban transportation in Germany and Europe as a Robert Bosch Foundation Fellow

Month

October 2016

Promoting Transit isn’t Enough, Germany also Makes Driving Expensive

tankstelle-2
Gasoline between $6.54 and $6.95 per gallon. Diesel is $5.91 per gallon. Source: http://kfz-meisterbetrieb-bauer.de

This is an adaptation of sections of my final fellowship paper found here.

Ralph Buehler and John Pucher in their paper Demand for Public Transport in Germany and the USA: An Analysis of Rider Characteristics, have analyzed several different policies that lead to higher transit mode share. Some of them would be fairly simple (though not easy) to implement in the US, such as increasing the federal fuel tax or vehicle registration fees. Others, such as Federal, State and Local coordination in land use planning, would be much more difficult.

Policies are key tools to promote transit ridership, but are usually not under the purview of transit agencies themselves. In Germany, they have been very successful, and generally fall under three themes:

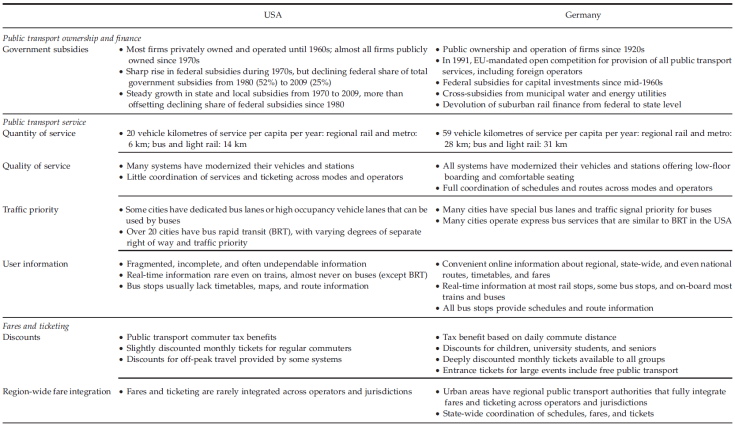
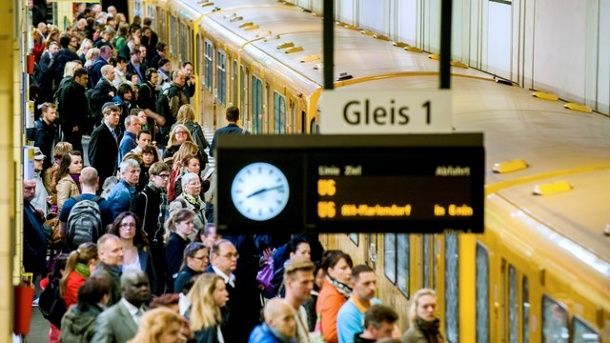
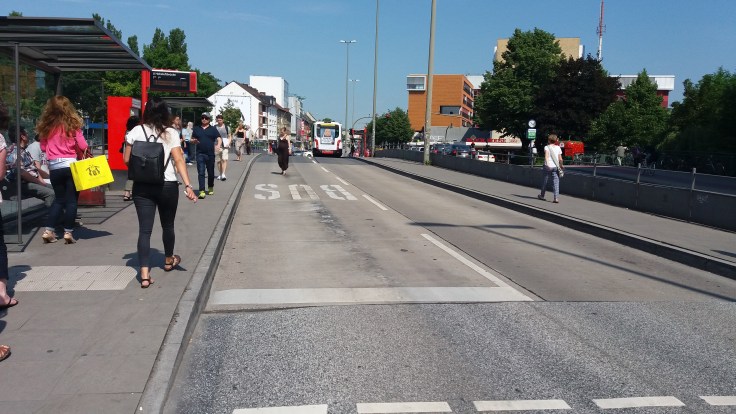
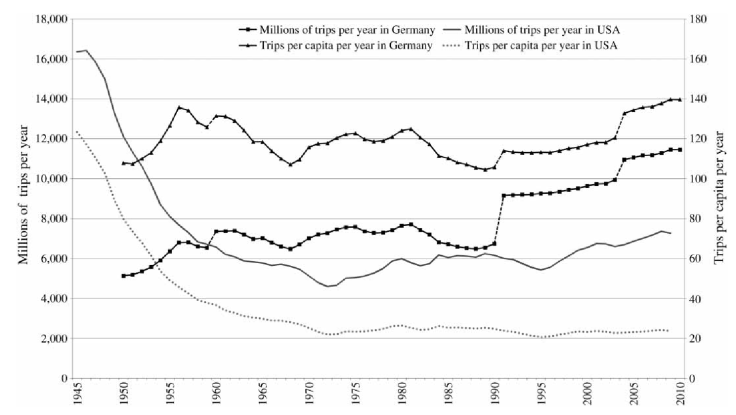
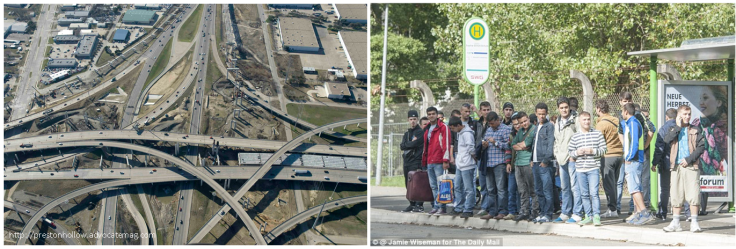
  • Transit-focused policies, programs and practices – Germany has three times as many transit service kilometers per capita as the US (59 vs. 20). Policies and practices that favor transit, such as transit signal priority and other bus infrastructure, modern buses, coordination between different providers and between different modes, all make transit more attractive. Unlimited ride passes (daily, monthly, annual, etc.) are very common, offering up to 60% reductions over single fares. This eliminates the marginal cost structure of rides in favor of a fixed cost, similar to monthly vs. hourly parking rates. There have also been deep reductions in fares for special tickets, such as student, elderly, and disabled tickets. Additionally, vehicles themselves are on average newer, and it is much more common to have bus shelters and better information at stops. All these measures make transit much more affordable and attractive.
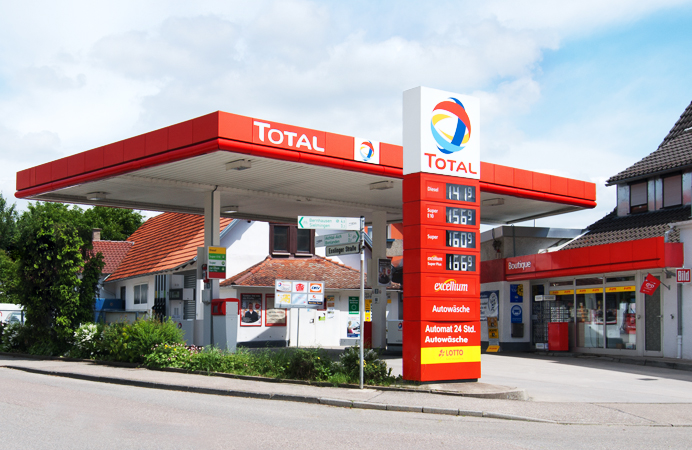
  • Restrictions on car use – policies and pricing are important tools to limit driving. From obtaining a driver’s license to sales tax on vehicles to the tax on fuel, Germany’s fees are much higher than in the US. The effect is that fuel tax revenue in Germany is 2.5 times higher than roadway expenditures; in the US, fuel tax revenue only covers 60% of roadway costs. (The rest is transferred from the general fund because the federal fuel tax has not been raised in 20 years.) In addition, Germany has several policies that restrict car use. For example, highways are generally only found on the fringes of cities, cities are reducing the number of parking spaces in downtowns and increasing parking prices, and most cities have extensive traffic calming in their residential neighborhoods.
  • Land use policies – denser development with mixes of uses and restrictions on off-street (private) parking encourage more car-free households, more walking and biking due to short trips, and more efficient transit operations by transporting more people over shorter distances. German planning law requires the integration of transportation planning (as well as water, energy and environmental planning) into land use plans.

policy-comparison-1

policy-comparison-2

Important to note, therefore, is that transit ridership depends on a lot more factors than a transit operator has control over. Many of these German policies would be relevant and possible in the US. But keeping this in mind, there are several features to examine that transit organizations themselves can do to be more effective.

Rich Germans Ride Transit More than Poor Americans

ubahn-fahrgaeste
Source: t-online.de. Photo: Hauke-Christian Dittrich

This is an adaptation of sections of my final fellowship paper found here.

Ralph Buehler and John Pucher in their paper Demand for Public Transport in Germany and the USA: An Analysis of Rider Characteristics, have analyzed and compared ridership trends in Germany and the US. In the US, the biggest share of transit trips is commuting to work, (35% in 2008/2009, Figure 3), potentially lower than in 2001/2002 due to the recession. Interesting to note is that trips for personal and family visits (shopping, doctor visits, daycare, family events, etc.) rose to almost the same level of commuting (32%) from eight years earlier (29%). Social and recreational trips also increased over eight years to 20% of all trips. In Germany, trip purposes stayed mainly the same over the same eight year period.

trip-purpose
Figure 3. Main purpose of public transport trips in Germany and the USA, 2001/2002 and 2008/2009. Note: The category ‘family and personal business’ includes trips for shopping, doctor’s visits, daycare, dog walking and other animal care, transporting someone else, using professional services, and attending family events. Source: Buehler’s and Pucher’s calculations based on NHTS and MiD.

In Germany, riders under the age 24 have the highest percentage of all trips (16-17% in 2008/2009) taken by transit, as opposed to the US where they are similarly as low as other age groups (1-3% in 2008/2009). This may be due to the large fleets of suburban school buses, whereas German students primarily use public transportation (which may increase their acceptance of transit as adults). A key difference is that those over the age of 65 in Germany ride transit at a higher rate than those 25-64. In the US, this age group uses transit even less than working age adults (1.4% compared to 2%), perhaps due to the importance of work-based transit trips.

trips-by-characteristics
Figure 4. Percentage share of trips by public transport in Germany and the USA by car access, employment status, and income quartile, 2001/2002 and 2008/2009. Source: Buehler’s and Pucher’s calculations based on NHTS and MiD.

To no surprise, people with no car in their household had the highest transit usage in both countries (Figure 4). But in households with one or more cars per driver, transit ridership in the US was almost non-existent, as opposed to in Germany where it was still an important mode, perhaps due to the attractiveness of transit or to the costs of driving in Germany. People in the lowest income quartile in both countries had the highest ridership rates, however what is most surprising is that Germans in the highest quartile rode transit about twice as much as Americans in the lowest quartile.

This last fact cannot be stressed enough, and may depend on many factors. Perhaps there is some truth to the “rail-bias” idea. Perhaps land uses and higher quality service in general make transit more convenient for everyone in Germany. It is also possible that the ease of car ownership and driving, coupled with the lower quality service in most of the US actually keep low-income people from using transit.

US and German Transit: A Brief History

This is an adaptation of sections of my final fellowship paper found here.

people-waiting-for-brt
Waiting for the bus in Hamburg

Ralph Buehler and John Pucher in their paper Demand for Public Transport in Germany and the USA: An Analysis of Rider Characteristics, have analyzed historical trends and events in transit in Germany and the US. Objectively speaking, Americans do not take many transit trips, on average. Between 2005 and 2010, the average American made 24 per year. In Germany that number was 139. (Figure 1) The US figure is lower than any other Western European country or Canada.

transit-trip-per-capita
Figure 1. Number of annual public transport trips per capita in Europe and North America, 2005–2010. Note: Due to differences in survey design, trip definitions, and timing, travel survey results among countries are not entirely comparable. Sources: APTA, 2012; BFS, 2011; BMVBS, 1991–2012; CBS, 2011; DfT, 2011; DMT, 2010; ITF, 2011; SIKA, 2007; SOeS, 2010; TOI, 2011; USDOT, 2010; WSP, 2006.

And while total number of trips in both countries has been rising in recent years, trips per capita have been rising consistently in Germany since the 1990s. In the US, they have stayed constant since the 1970s. (Figure 2)

transit-ridership-trends
Figure 2. Trend in total public transport trips and trips per capita in Germany and the USA, 1945–2010. Notes: Data from 1950 to 1990 are for West Germany only. West German data from 1950 to 1960 exclude West Berlin and the Saarland. German data from1991 to 2010 are for the re-unified Germany, including the former East Germany. The strong increase in Germany between 2003 and 2004 is a statistical artifact due to a change in data collection methodology. Public transport trips as shown in this graphic are defined from origin to destination; thus, a trip involving transfers between public transport lines or modes is counted as one trip (technically designated as a linked trip). Since 1970 official data for the USA report unlinked trips, with transfers counted as additional trips. This study converted the unlinked trips to linked trips in order to ensure comparability with Germany, using a methodology explained in Polzin and Chu (2003). Source: APTA, 2012; BMVBS, 1991–2012.

So what happened? Between the 1940s and 1970s, transit use in the US dropped by 75% due to the ending of wartime rationing, increased automobile production, increasing incomes, and suburban sprawl. This drop was stopped by extensive support from all levels of government, averaging $23 billion per year (in 2010 dollars), which, despite a drop in the 1980s, continues today.

In Germany, most public transportation infrastructure was usable again by the early 1950s after being damaged in World War 2, and the combination of increased work trips, low automobile ownership, and cities crowded with ethnic Germans arriving from Eastern Europe kept transit ridership high. However, by the 1960s, car ownership tripled, sprawl grew on urban fringes, the federal highway network expanded, and cities widened roads and built parking garages. Subsidies in transit operating and capital costs raised ridership as in the US until the 1980s. The large spike in Figure 2 around 1991 represents the reunification; however the increase in ridership between 1991 and the early 2000s occurred almost exclusively in the former West, and offset heavy ridership losses in the former East. Since the early 2000s, ridership gains have been seen throughout Germany. These gains are partly due to a doubling of the gas tax (from $0.41/liter in 1990 to $0.88/liter in 2010), but also to better transit service (regional coordination, vehicles, information, etc.).

Germany and the US, as mentioned in the last article, both experienced high motorization rates and ridership declines. However, German authorities deliberately implemented policies to increase ridership. The US has not yet done so with such vigor.

Similarities and Differences between German and US Transportation

hwy-bus-stop
Dallas freeway interchange, congested German bus stop. Sources: http://prestonhollow.advocatemag.com, dailymail.co.uk.

This is an adaptation of sections of my final fellowship paper found here.

Ralph Buehler, John Pucher and others have done an amazing amount of research comparing German and US transportation systems in the last several years that I’ll try to summarize in the next several posts. And hopefully I’ll get all my footnotes correct.

Germany and the US have much  in common in terms of transportation, and therefore Germany offers many lessons in general for a more sustainable balance to transportation. Both countries are democracies, both have strong automobile manufacturing sectors (and automobile industry lobbying sectors), they are among the wealthiest countries with some of the largest roadway systems in the world. Germany has one of the highest car ownership rates in the world after the U.S., and the trend of car ownership has grown similarly since the 1960s.

Despite the image of the US being the land of suburban sprawl, German cities have also been decentralizing. Indeed, because of bombing and destruction of World War 2, much of the urban development in Germany is new, similar to urban development in the US.

As any American visitor to Germany can see, however, German transportation systems are very different, characterized by much less driving and more transit use, biking and walking. For example, even in rural areas around Stuttgart, which suffers from the worst congestion of any German city because of its high share of private vehicles, transit ridership is higher than in downtown Arlington, Virginia, which is seen as a model for American transit-oriented suburban development.  Here are some other facts:

  • Carbon dioxide emissions from transportation per capita in Germany are about 30% of the amount in the US (2005).
  • German households spend less on transportation costs than American households (14% vs. 19% in 2003), even though fuel is notoriously less expensive in the US.
  • Traffic fatalities in Germany are less than half per 100,000 residents as in the U.S. (6.5 vs. 14.7 from 2002-2005).
  • Transit agency operating budgets are hardly subsidized in Germany compared with the US (26% of operating budgets in Germany vs. 62% of budgets in the US in 2006).
  • Government subsidies for transportation in general are less in Germany per capita than in the US ($460 vs. $625 in 2006).

While these figures are somewhat dated, and reductions in driving are occurring in both countries at the moment, they highlight the fact that transportation in Germany is cleaner, safer, and less expensive than in the US. Travel behavior is the primary determinant and is influenced by both transportation policies and urban development patterns.

These facts come from:

Ralph Buehler, Wolfgang Jung, Andrea Hamre and Paul Stoddard (2013): Planning for Sustainable Transport in Germany and the USA: A Comparison of the Washington, DC and Stuttgart Regions, American Institute for Contemporary German Studies.

Ralph Buehler and John Pucher, Demand for Public Transport in Germany and the USA: An Analysis of Rider Characteristics. Transport Reviews, Vol. 32, No. 5, 541–567, September 2012


Blog at WordPress.com.

Up ↑