This is an adaptation of sections of my final fellowship paper found here.
Ralph Buehler and John Pucher in their paper Demand for Public Transport in Germany and the USA: An Analysis of Rider Characteristics, have analyzed several different policies that lead to higher transit mode share. Some of them would be fairly simple (though not easy) to implement in the US, such as increasing the federal fuel tax or vehicle registration fees. Others, such as Federal, State and Local coordination in land use planning, would be much more difficult.
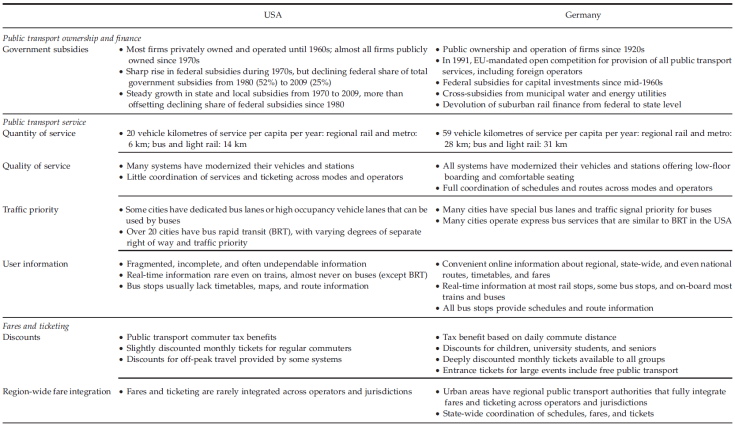
Policies are key tools to promote transit ridership, but are usually not under the purview of transit agencies themselves. In Germany, they have been very successful, and generally fall under three themes:
Transit-focused policies, programs and practices – Germany has three times as many transit service kilometers per capita as the US (59 vs. 20). Policies and practices that favor transit, such as transit signal priority and other bus infrastructure, modern buses, coordination between different providers and between different modes, all make transit more attractive. Unlimited ride passes (daily, monthly, annual, etc.) are very common, offering up to 60% reductions over single fares. This eliminates the marginal cost structure of rides in favor of a fixed cost, similar to monthly vs. hourly parking rates. There have also been deep reductions in fares for special tickets, such as student, elderly, and disabled tickets. Additionally, vehicles themselves are on average newer, and it is much more common to have bus shelters and better information at stops. All these measures make transit much more affordable and attractive.
Restrictions on car use – policies and pricing are important tools to limit driving. From obtaining a driver’s license to sales tax on vehicles to the tax on fuel, Germany’s fees are much higher than in the US. The effect is that fuel tax revenue in Germany is 2.5 times higher than roadway expenditures; in the US, fuel tax revenue only covers 60% of roadway costs. (The rest is transferred from the general fund because the federal fuel tax has not been raised in 20 years.) In addition, Germany has several policies that restrict car use. For example, highways are generally only found on the fringes of cities, cities are reducing the number of parking spaces in downtowns and increasing parking prices, and most cities have extensive traffic calming in their residential neighborhoods.
Land use policies – denser development with mixes of uses and restrictions on off-street (private) parking encourage more car-free households, more walking and biking due to short trips, and more efficient transit operations by transporting more people over shorter distances. German planning law requires the integration of transportation planning (as well as water, energy and environmental planning) into land use plans.
Important to note, therefore, is that transit ridership depends on a lot more factors than a transit operator has control over. Many of these German policies would be relevant and possible in the US. But keeping this in mind, there are several features to examine that transit organizations themselves can do to be more effective.
This is an adaptation of sections of my final fellowship paper found here.
Ralph Buehler and John Pucher in their paper Demand for Public Transport in Germany and the USA: An Analysis of Rider Characteristics, have analyzed and compared ridership trends in Germany and the US. In the US, the biggest share of transit trips is commuting to work, (35% in 2008/2009, Figure 3), potentially lower than in 2001/2002 due to the recession. Interesting to note is that trips for personal and family visits (shopping, doctor visits, daycare, family events, etc.) rose to almost the same level of commuting (32%) from eight years earlier (29%). Social and recreational trips also increased over eight years to 20% of all trips. In Germany, trip purposes stayed mainly the same over the same eight year period.
Figure 3. Main purpose of public transport trips in Germany and the USA, 2001/2002 and 2008/2009. Note: The category ‘family and personal business’ includes trips for shopping, doctor’s visits, daycare, dog walking and other animal care, transporting someone else, using professional services, and attending family events. Source: Buehler’s and Pucher’s calculations based on NHTS and MiD.
In Germany, riders under the age 24 have the highest percentage of all trips (16-17% in 2008/2009) taken by transit, as opposed to the US where they are similarly as low as other age groups (1-3% in 2008/2009). This may be due to the large fleets of suburban school buses, whereas German students primarily use public transportation (which may increase their acceptance of transit as adults). A key difference is that those over the age of 65 in Germany ride transit at a higher rate than those 25-64. In the US, this age group uses transit even less than working age adults (1.4% compared to 2%), perhaps due to the importance of work-based transit trips.
Figure 4. Percentage share of trips by public transport in Germany and the USA by car access, employment status, and income quartile, 2001/2002 and 2008/2009. Source: Buehler’s and Pucher’s calculations based on NHTS and MiD.
To no surprise, people with no car in their household had the highest transit usage in both countries (Figure 4). But in households with one or more cars per driver, transit ridership in the US was almost non-existent, as opposed to in Germany where it was still an important mode, perhaps due to the attractiveness of transit or to the costs of driving in Germany. People in the lowest income quartile in both countries had the highest ridership rates, however what is most surprising is that Germans in the highest quartile rode transit about twice as much as Americans in the lowest quartile.
This last fact cannot be stressed enough, and may depend on many factors. Perhaps there is some truth to the “rail-bias” idea. Perhaps land uses and higher quality service in general make transit more convenient for everyone in Germany. It is also possible that the ease of car ownership and driving, coupled with the lower quality service in most of the US actually keep low-income people from using transit.
This is an adaptation of sections of my final fellowship paper found here.
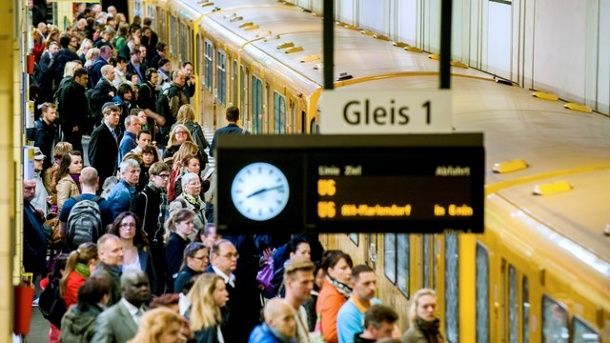
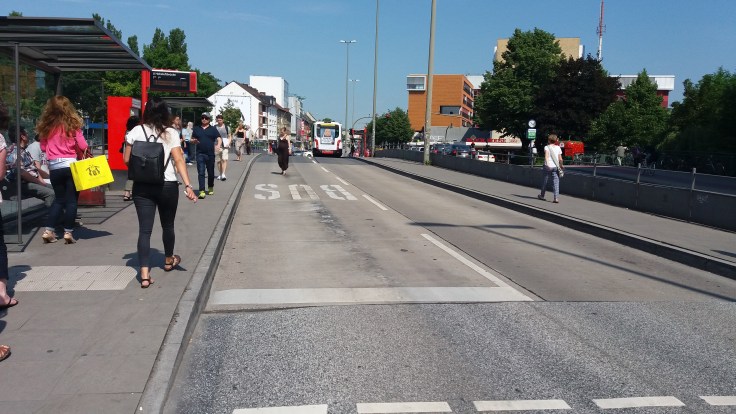
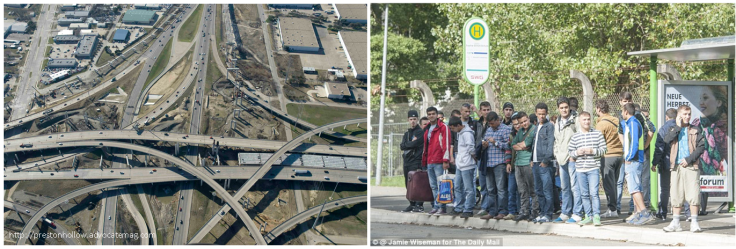
Waiting for the bus in Hamburg
Ralph Buehler and John Pucher in their paper Demand for Public Transport in Germany and the USA: An Analysis of Rider Characteristics, have analyzed historical trends and events in transit in Germany and the US. Objectively speaking, Americans do not take many transit trips, on average. Between 2005 and 2010, the average American made 24 per year. In Germany that number was 139. (Figure 1) The US figure is lower than any other Western European country or Canada.
Figure 1. Number of annual public transport trips per capita in Europe and North America, 2005–2010. Note: Due to differences in survey design, trip definitions, and timing, travel survey results among countries are not entirely comparable. Sources: APTA, 2012; BFS, 2011; BMVBS, 1991–2012; CBS, 2011; DfT, 2011; DMT, 2010; ITF, 2011; SIKA, 2007; SOeS, 2010; TOI, 2011; USDOT, 2010; WSP, 2006.
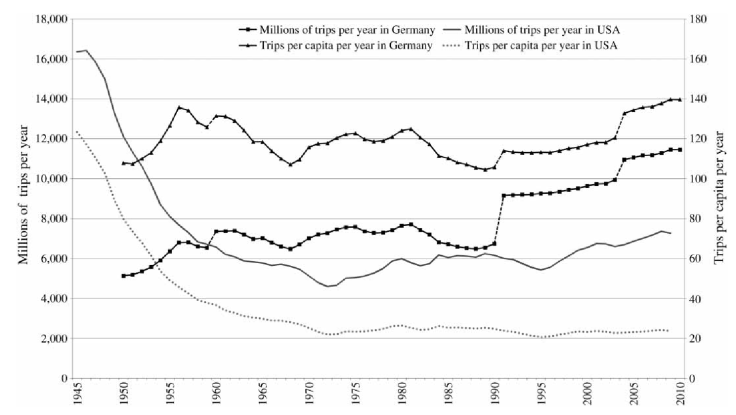
And while total number of trips in both countries has been rising in recent years, trips per capita have been rising consistently in Germany since the 1990s. In the US, they have stayed constant since the 1970s. (Figure 2)
Figure 2. Trend in total public transport trips and trips per capita in Germany and the USA, 1945–2010. Notes: Data from 1950 to 1990 are for West Germany only. West German data from 1950 to 1960 exclude West Berlin and the Saarland. German data from1991 to 2010 are for the re-unified Germany, including the former East Germany. The strong increase in Germany between 2003 and 2004 is a statistical artifact due to a change in data collection methodology. Public transport trips as shown in this graphic are defined from origin to destination; thus, a trip involving transfers between public transport lines or modes is counted as one trip (technically designated as a linked trip). Since 1970 official data for the USA report unlinked trips, with transfers counted as additional trips. This study converted the unlinked trips to linked trips in order to ensure comparability with Germany, using a methodology explained in Polzin and Chu (2003). Source: APTA, 2012; BMVBS, 1991–2012.
So what happened? Between the 1940s and 1970s, transit use in the US dropped by 75% due to the ending of wartime rationing, increased automobile production, increasing incomes, and suburban sprawl. This drop was stopped by extensive support from all levels of government, averaging $23 billion per year (in 2010 dollars), which, despite a drop in the 1980s, continues today.
In Germany, most public transportation infrastructure was usable again by the early 1950s after being damaged in World War 2, and the combination of increased work trips, low automobile ownership, and cities crowded with ethnic Germans arriving from Eastern Europe kept transit ridership high. However, by the 1960s, car ownership tripled, sprawl grew on urban fringes, the federal highway network expanded, and cities widened roads and built parking garages. Subsidies in transit operating and capital costs raised ridership as in the US until the 1980s. The large spike in Figure 2 around 1991 represents the reunification; however the increase in ridership between 1991 and the early 2000s occurred almost exclusively in the former West, and offset heavy ridership losses in the former East. Since the early 2000s, ridership gains have been seen throughout Germany. These gains are partly due to a doubling of the gas tax (from $0.41/liter in 1990 to $0.88/liter in 2010), but also to better transit service (regional coordination, vehicles, information, etc.).
Germany and the US, as mentioned in the last article, both experienced high motorization rates and ridership declines. However, German authorities deliberately implemented policies to increase ridership. The US has not yet done so with such vigor.
This is an adaptation of sections of my final fellowship paper found here.
Ralph Buehler, John Pucher and others have done an amazing amount of research comparing German and US transportation systems in the last several years that I’ll try to summarize in the next several posts. And hopefully I’ll get all my footnotes correct.
Germany and the US have much in common in terms of transportation, and therefore Germany offers many lessons in general for a more sustainable balance to transportation. Both countries are democracies, both have strong automobile manufacturing sectors (and automobile industry lobbying sectors), they are among the wealthiest countries with some of the largest roadway systems in the world. Germany has one of the highest car ownership rates in the world after the U.S., and the trend of car ownership has grown similarly since the 1960s.
Despite the image of the US being the land of suburban sprawl, German cities have also been decentralizing. Indeed, because of bombing and destruction of World War 2, much of the urban development in Germany is new, similar to urban development in the US.
As any American visitor to Germany can see, however, German transportation systems are very different, characterized by much less driving and more transit use, biking and walking. For example, even in rural areas around Stuttgart, which suffers from the worst congestion of any German city because of its high share of private vehicles, transit ridership is higher than in downtown Arlington, Virginia, which is seen as a model for American transit-oriented suburban development. Here are some other facts:
Carbon dioxide emissions from transportation per capita in Germany are about 30% of the amount in the US (2005).
German households spend less on transportation costs than American households (14% vs. 19% in 2003), even though fuel is notoriously less expensive in the US.
Traffic fatalities in Germany are less than half per 100,000 residents as in the U.S. (6.5 vs. 14.7 from 2002-2005).
Transit agency operating budgets are hardly subsidized in Germany compared with the US (26% of operating budgets in Germany vs. 62% of budgets in the US in 2006).
Government subsidies for transportation in general are less in Germany per capita than in the US ($460 vs. $625 in 2006).
While these figures are somewhat dated, and reductions in driving are occurring in both countries at the moment, they highlight the fact that transportation in Germany is cleaner, safer, and less expensive than in the US. Travel behavior is the primary determinant and is influenced by both transportation policies and urban development patterns.
Several weeks ago I started my second work placement at the Hamburger Hochbahn, AG. The Hochbahn, which literally means “high rail,” gets its name from the very first urban train line in Hamburg, a mostly elevated rail that makes a ring around the central Alster Lake and provides one of the best views of the Harbor. (Since then, the norm is to build subways mostly underground.) Since its founding in 1911, the Hochbahn has evolved into the largest transit provider in Hamburg, operating the entire U-Bahn (subway) network and most of the bus lines. Here’s some quick facts:
Daily Ridership: ~1.2 million
Annual ridership: 438 million (almost exactly evenly split between bus and rail)
Subway lines: 4
Bus routes: 111
Train stations: 91
Bus Stops: 1,321
Train cars: 232
Buses: 803
Annual budget: 424.3 € (~$478 million)
Employees: ~5,000
The Hochbahn AG is a private corporation, but 100% of the shares are owned by the city of Hamburg. This is a typical model in Germany for services that are semi-public in nature (water, electricity, etc), with the advantage that the budgets can be more easily isolated and analyzed. The Hochbahn also owns several subsidiaries, including two smaller bus companies that serve smaller markets in less populated areas of Hamburg, the ferry service, another tourist boat line, and the Intercity bus station. A key difference is that many services that in the US would either be part of a transit authority’s standard personnel or outsourced to another company are also provided by Hochbahn-owned subsidiaries, such as bus and rail maintenance operations, security service (similar to a transit police), IT service, advertising, housing for employees, and the cleaning service. This gives these subsidiaries the opportunity to also provide services to outside customers to increase revenue. (The Hochbahn covers 90% of its own costs, receiving a very small subsidy compared to US transit agencies. This includes not only revenue from passengers, but advertising, storefront rentals, etc.)
The Hochbahn has several innovative programs, some of which go far beyond the normal scope of a transit provider.
Bus optimization, which is most similar to Bus Rapid Transit in US cities
The Innovation Line 109 a 10 km (~6,2 mile) line tests new types of engines (including all electric) in conjunction with manufacturers
Switchh, a program that more seamlessly connects carsharing with transit fare cards, showing Hochbahn’s proactive emphasis on helping to steer multi-modal transportation in Hamburg
Accessible rail stations and bus stops
Planning for the U5 subway line
Over the next several months, I’ll be working specifically on the Schnellbus project: what to do with an outdated collection of 5 bus lines that are no longer necessary but politically impossible (up until now, at least) to eliminate. In addition, I’m learning how German transit providers plan, provide, and fund service.
Berlin was founded in the 12th century, made capital of Prussia in 1701, served as the capital of Germany until 1945, was separated after World War II by walls, moats, barbed wire and bullets, and reunited in 1990. Since the 1990s, it has been a center of partying, party tourism and techno music, and increasingly a European political powerhouse.
Hamburg was founded in the 9th century and has grown its wealth over the last millennium as a key European harbor city, which has led to enormous diversity of people, spices, and well, the Reeperbahn.
Berlin’s population (~3.5 million) is about double Hamburg’s. Hamburg’s transit is generally recognized as the HVV, the regional transit association overseeing the 30 transit providers in the metro area. Berlin’s transit is mostly identified with the BVG, Berlin’s major transit provider of buses, trams, and the U-Bahn (subway). In 2014, the BVG saw 978 million boardings (not including the express or regional trains), HVV saw 738 million. Hamburg’s reputation is preppy and stuck up. Berlin is poor but sexy. So who has the most convincing transit ad? Are they indicative of the city culture?
The BVG hired the rap artist Kazim Akboga to make “Is mir egal” (I don’t care) with the message, “Only we love you, just like you are.” It’s a hilarious display of all the types of people you might run into on a subway in Berlin.
The HVV went with a much different tone, showing major destinations in Hamburg, and once the excitement is over and real life begins again, “Komm gut nach Hause!” (Get home well).
So which do you like better? By the way, the BVG also sells clothes and cell phone covers with the ugly spotty pattern in some of their U-Bahns. And they used to sell underwear with station names like Schöneberg (Beautiful Mountain), and Krumme Lanke (Crooked, uh, Lanke?)
51 years ago, if someone wanted to take transit from one side of Hamburg to the other, taking the subway to the commuter train to a bus, that person would have to pay three different fares to three different transit providers to make one trip. With the competition of the private automobile putting pressure on public transportation systems worldwide, the three biggest transit providers and the City of Hamburg decided to collaborate and form the Hamburger Public Transportation Association (Hamburger Verkehrsverbund – HVV). The goal was to provide a unified fare structure, a unified fare card, and a unified timetable. This is the first such Public Transportation Association in the world, spurring dozens more within Germany, Europe, and also the US.
Many urban residents in the US also shared the same problem, albeit until the 1930s or so. Streetcar and train lines were generally privately owned, and city governments granted these private companies rights to operate on certain streets (often through bribes, blackmail, and other nefarious means). The problem of transferring between different transit companies was often solved by local laws requiring free transfers. However, in the 1930s and 1940s many private transit companies went bankrupt due to competition with the private automobile and aging infrastructure that needed to be replaced. City governments usually consolidated transit lines under one semi-public entity (for example the Chicago Transit Authority [CTA]), that was responsible for both the transit provision and operations, as well as the financial authority, fare structuring, planning, and general politics of public transportation.
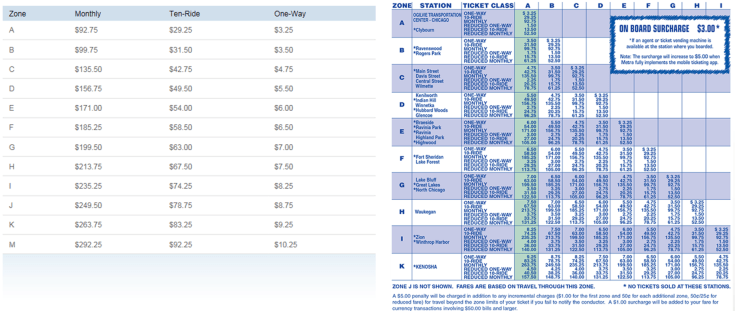
Today, there are many cities and regions with several, sometimes competing, transit providers and no regional entity that unites them. For example, in Chicago, the CTA, Metra commuter rail, and Pace suburban bus all fall under the funding umbrella of the Regional Transportation Authority. However, there are bitter fights just about every year for funding among the three providers. With regards to a unified system for passengers, the three providers began using the contactless Ventra system for passengers to pay for all three transit services (but only after the Illinois General Assembly mandated it) over the last several years. But due to the fact that a passenger pays based on distance on Metra, but to board CTA or Pace bus or train, the fare structure is not unified, and each provider decides for itself the fare and fare structure (see below).
CTA Fare Structure. Source: CTAPace Suburban Bus Fare Structure. Source: PaceMetra Commuter Rail Fare Structure and Example of Zone Clarifications. Source: Metra
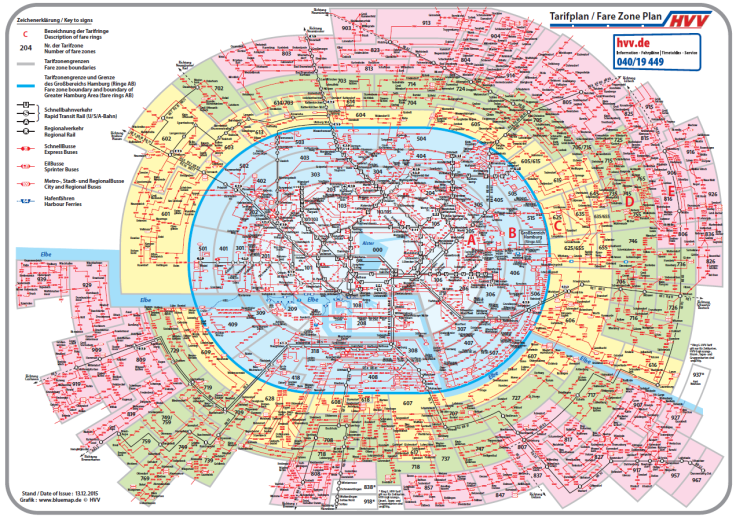
In Hamburg, the fare is the same regardless of the provider or how many transfers, and only depends on the locations of the origin and destination based on the (extremely precise and sometimes incomprehensible) ring and zone structure. The basic ticket is for the blue A and B rings (Grossbereich) in the center (See Map Below). Then, depending on how many rings, the price rises. For more local trips, there are short and close tickets, and tickets based on zones, especially for the outer, rural areas. (Most passengers use daily, monthly, or annual passes.) But despite how complicated this sounds, with a basic Grossbereich ticket a passenger can travel anywhere within the city limits of Hamburg (plus some) on any mode, be it local bus, commuter train, ferry, subway, or any combination of those, no matter which transit provider one rides with. It should also be noted that Hamburg, like most of Germany, uses a proof-of-payment fare system, so that officials can verify that a passenger has indeed paid to be in a specific zone. This is in contrast to most US systems (like Chicago), where a passenger simply pays to enter the system or vehicle, no matter how far one rides. Therefore, some of this would not be transferrable to many contexts in the US.
HVV Fare Zone Map. Actual price tables unavailable. Source: HVV
Transit providers are paid through the HVV using a calculation that combines kilometers driven (as is the case with many Latin American BRT systems) and passengers. Because of this, it eliminates competition for passengers, which originally led a provider to run express buses parallel to the express train routes. Instead, HVV can plan transit routes from a system-wide perspective so that, for example, bus routes feed into the train stations and connect areas not served by train service. This creates a more efficient system without decreasing profits for the providers.
Organizationally, HVV began as an association of transit providers. However, as the HVV grew (and the HVV jurisdictional area), more providers fell under its purview. In the 1990s, because its role involved negotiating contracts on behalf of municipal entities, its role changed to an association representing these municipal entities instead of the transit providers with whom it negotiated contracts. Therefore, much of the technical expertise of operations was transferred to the providers.
Today, HVV represents seven state and county-level transit authorities, and oversees the operations of approximately 30 transit providers. It provides quality control over all the services, and often represents the perspectives of passengers in transit-related matters. Below is a list of HVV accomplishments over the past 50 years:
1966/67 – First unified fare card for individual rides for the entire HVV area.
1967 – First schedule book listing exact bus schedules for all bus services
1970 – Abonnements – monthly on-going subscriptions, 20,000 customers in the first year
1972 – First women bus drivers
1980 – Telephone customer service starts
1981 – Bicycles allowed on subways and express trains
1985 – Combo-transit tickets with concerts
1988/89 – Founding of the Handicapped Advisory Council with the goal of making the entire HVV network fully accessible
1991 – Introduction of the subscription tickets for large customers (employers)
1994 – Semester tickets for students
1995 – Electronic schedule system
1996 – Restructuring of HVV from an association of providers to an association of transit authorities
1997 – HVV webpage is live, and the founding of the Passenger Advisory Council
2001 – Metrobus system is introduced, guaranteeing 10 minutes headways until 9pm.
2001 – Online ticket sales began
2002-2004 – Expansive HVV growth
2005 – First night trains (weekends only)
2007 – Smartphone ticketing
2011 – Customer guarantee (on-time or your money back)
2012 – HVV app and mobile ticketing
2012 – HVV expands its role to carsharing and rental cars
Rendering of Hamburg’s OlympiaCity. Source: Olympic Sustainability Concept
Earlier this month, the Free and Hanseatic City of Hamburg released its mobility plan for its bid for the 2024 Olympics. Competing against Paris, Rome, and Los Angeles, Hamburg, a city of “only” 1.8 million people might seem like the underdog. However, Hamburg is boasting its waterfront beauty, long summer days, and most of all, it is setting itself apart by stressing the sustainability of its Olympic plan.
It is generally recognized that sustainability has three spheres (or pillars, or legs of a stool): economic, social, and environmental. In the Declaration of Intent between the Naturschutzband Deutschland (Nature And Biodiversity Conservation Union), the Zukunftsrat Hamburg (the Hamburg Future Council), the Free and Hanseatic City of Hamburg, and the Deutscher Olympischer Sportbund (German Olympic Sports Confederation), aspects of the sustainability plan were outlined. Economically, Hamburg is ensuring that temporary structures not become a burden on the city coffers. Socially, the City will use its contracting leverage to promote social inclusion, equal opportunity, good working conditions and international solidarity. Environmentally, Hamburg would use the Olympic Games as a tool for sustainable city planning, mobility, climate change mitigation and adaptation, greenspace protection, reducing water and air pollution, resource efficiency, und sustainable consumption and production. Overall, the goal of the Hamburg Olympics is to be carbon-neutral and to retain green spaces.
Taking a deeper dive into the mobility plan, the base assumptions are that the players and spectators get to their games, that the City keeps running as usual, and that the Port, the second biggest in Europe, operates without disturbance. In addition, through traffic and mobility management and ITS, the goal is to actually decrease traffic by 10%.
With these goals in mind, how does a city develop a mobility plan for the Olympics at all? Starting with the numbers:
7,500,000 tickets
4,000,000 spectators (600,000 per day)
200,000 employees and volunteers
70,000 IOC, media, and support
10,500 athletes
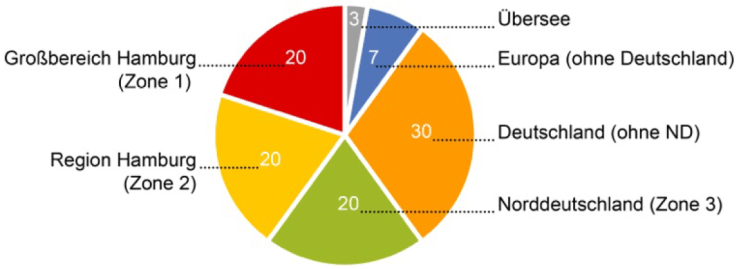
So, per day that means about 850,000 additional people to move. Because of the lack of hotel space in Hamburg, the City estimates that about 20% of these 850,000 will come from the city of Hamburg, another 20% from a large ring around Hamburg (stretching to the Baltic Sea), and 20% more from other locations within Northern Germany. Another 30% will come from the rest of Germany, and the other 10% will come from other European countries or from overseas.
Where Olympic-goers will be coming from. Source: Behörde für Wirtschaft, Verkehr und Innovation (BWVI)
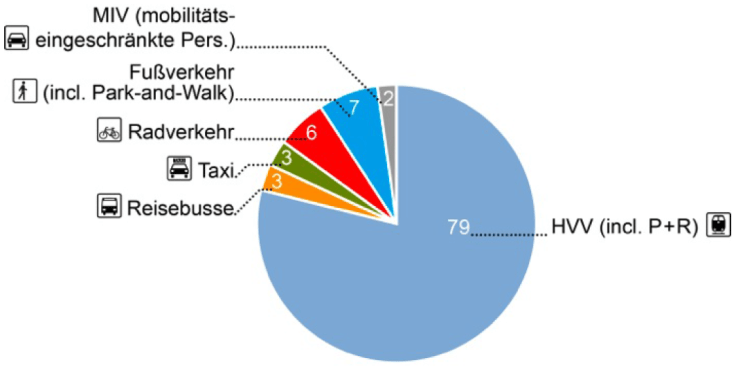
Once in Hamburg, the goal is that 79% of spectators will use public transportation to reach their destinations. An additional 13% should arrive by bike or foot. That alone is extremely ambitious, but since most destinations are close to the urban rail system, it is not out of the question. And luckily, most of the 850,000 people per day are expected to travel outside the normal peak hour.
Modal Split for Olympic-goers within Hamburg. HVV = Public transportation, MIV = Private autos for persons with disabilities, Fußverkehr = Pedestrians, Radverkehr = Bicycle, Reisebusse = Tour busses. Source: BWVI
In order to be able to move this many people, Hamburg is preparing to invest in several kinds of improvements, including:
Temporary infrastructure, like airport and tourbus parking
New infrastructure for the Olympics that will remain permanent, such as extra entrances/exits to specific subway and train stations, ferry stations, and bridges; building out and expanding bicycle infrastructure and sidewalks, and extending a subway line
Speeding up capacity improvement projects that have already been planned for normal operations, for example extending urban rail lines, renovating and modernizing major train stations including accessibility improvements (making all stations ADA accessible, such as elevators)
Capacity-improving operations, such as more frequent buses and trains and larger vehicles
Transportation and Mobility Management, for example ITS
Non-comprehensive map of temporary improvements (purple), pre-planned capacity improvements (green), and improvements that will be built for the Olympics but will remain permanently (red). Source: BWVI
Hamburg released a list of specific improvements (in German). Because most of the locations are very close to the current rail systems, most of the improvements are rail-focused. However, 280 additional buses are to be used during the games, some bus transfer stations will be expanded, and there will be improvements to several Metrobus corridors (bus routes with a minimum 10 minute headway throughout most of the city). Some corridors would see up to 42,000 bus riders per direction between 5pm and 6pm alone, which will necessitate roadway management plans in addition to bus infrastructure improvements. There will also be an extension of one of the ferry lines with an increased frequency of 3-5 minute headways.
Because of the small number of hotels in Hamburg, Olympic-goers will most likely come from these 3 Potential “Transit Zones.” Source: BWVI
Because travelers will not only be coming from within Hamburg, but even from throughout Germany, the question of transit ticketing must come up. While there is no firm decision on this, options include a Kombi-Ticket (included with an Olympic ticket for spectators and employees/volunteers), a flat rate for all users, or something more akin to the standard HVV rates, which have been accused of being extremely complicated. Then it must be calculated how funds brought in would be distributed to the different transit provider companies.
The Hamburg Senate has already set the goal of increasing the bicycle mode share to 25% by 2025 (from 12.8% in 2008) for all trips (not just commuting trips). The current plan is to construct a Veloroute network of uninterrupted bicycle paths throughout the city like a spider web. In addition, Hamburg is also planning on installing more bike racks at train stations and expanding its bikeshare system. Especially for the Olympics, the city has designated an Olympic bicycle network, which would include paving the sides of cobblestone streets and Olympic wayfinding. The bikesharing system would be temporarily expanded, and more bicycle parking will be installed.
Non-comprehensive maps of bicycle and pedestrian improvements for the Olympics. Purple = Temporary, pre-planned = green, permanent but planned for the Olympics = red. Source BWVI
The city is also planning on making most of the inner city (where most of the Olympic foot traffic would be) completely ADA accessible by 2024. According to the Olympic pedestrian network connecting various Olympic sites and the inner city, some sidewalks would be temporarily widened by moving bicycle traffic to the Olympic Lanes.
Private vehicle traffic and congestion would be optimized through specialized routes and lanes for the Olympic Special Transport (official Olympic business), mobility management, and identifying an Olympic Route System to prevent any construction or other delays. Additionally, a planned widening and burying of an Autobahn corridor would be realized.
Olympic Route Network and Olympic lanes. Source BWVI
With a non-motorized modeshare of 92%, Hamburg is eliminating a huge source of carbon emissions and road safety threats from its Olympic plans. Mostly relying on rail transit, the proposed improvements would lay the foundation for future sustainable city planning. The proposed Veloroute network would create long-distance bicycle infrastructure throughout the city. It can safely be argued that sustainability has been heavily incorporated into Hamburg’s Olympic mobility plan.
Hamburgers have until November 29 to vote via referendum whether or not the city should proceed with its Olympic bid. There are of course opponents to the bid, (and not without precedents from other cities). There is some evidence that even a failed bid may bring benefits. The City of Hamburg and others are touting many reasons to vote for the Olympics, which includes these very infrastructure improvements, and has answered some of questions raised by opponents. On November 30, we will see if this underdog will choose to compete.
Fire and Flame for Games in Hamburg. Official Logo for the Hamburg Bid.
In late October, I attended the First International Forum on Sustainable Mobilities sponsored by SNCF (France’s state-owned railway company) and CODATU (an NGO based in France working to promote sustainable transportation policies in developing countries). It was an invigorating event, full of high-profile speakers and interviews, with the overall message that sustainable transportation must be a key part of the upcoming UN Conference on Climate Change COP21 negotiations in December. Because SNCF was the major sponsor, there was a definite rail lean, especially when various countries talked about their upcoming rail transit projects, including Morocco’s High Speed Rail, Doha’s ambitious Doha Metro Plan to build 164 km (102 miles) of subway operational by 2019, and Melbourne’s solar powered tram system.
In light of the upcoming COP21, Laurence Tubiana, Special Representative for the 2015 Paris Climate Conference, said the transportation sector is the fastest growing source of carbon dioxide, which raises several questions including:
What does sustainable mobility mean for development?
How does climate change adaptation affect transportation? Transportation of the future must be able to adapt to more extreme environmental conditions (heat, cold, storms, etc.) than before.
How will sustainable transportation be funded? There needs to be plans for long term investments in sustainable infrastructure.
Can the future “new economy” grow without CO2?
How do we increase performance and mobility options while decreasing CO2?
The good news is that 155 countries already have climate plans, and they are increasingly recognizing the importance of city planning in encouraging people to choose low-carbon transportation options. These options (walking, biking, transit) then have the added benefits of reducing overall driving, which also reduces congestion, household costs, and crashes.
All of the speakers were interesting and extremely knowledgeable in their fields. Below are some points that I personally found interesting or new:
Holger Dalkmann (Director, Strategy and Global Policy, EMBARQ Director, WRI Ross Center for Sustainable Cities) underscored the importance of urban development in reducing carbon emissions. “60% of the 2050 infrastructure hasn’t been built yet,” and there is great opportunity to steer development to reduce future carbon emissions. However, cities need better long-term visions, such as transit-oriented development. With good transit in place now, people who move to cities won’t have to immediately start driving.
Vincent Kaufmann (Urban Sociology and Mobility Studies Professor at l’École Polytechnique Fédérale de Lausanne) talked about trends in Europe. In cities with 300,000-500,000 residents and more, public transportation and pedestrian mode shares increased (however, 82% Auto mode share is in many cities still a reduction). People aren’t using travel times as the main metric for mode choice anymore. Many people now just want a seat on the bus or train, even if the trip will last longer, because they see driving as a waste of time.
In addition, he explained that in Switzerland over the last 20 years, there has been an increase in public transportation, pedestrian and bicycle mode shares. He attributes it to assertive public policy, which has encouraged and supported efficient transit service and lifestyles based on public transportation, such as development around transit stations. The result is that people question how to get to their destinations, and in many cities the threshold has been reached to adopt other means of transportation besides the private automobile.
Zurich Tramways. Photo: Howard Jennings
Stephanie Pollack (Massachusetts Secretary of Transportation) talked about modernizing Massachusetts’ 19th century transportation network into a 21st century one. Economic development used to mean more traffic and more traffic jams, but it doesn’t have to, she said.
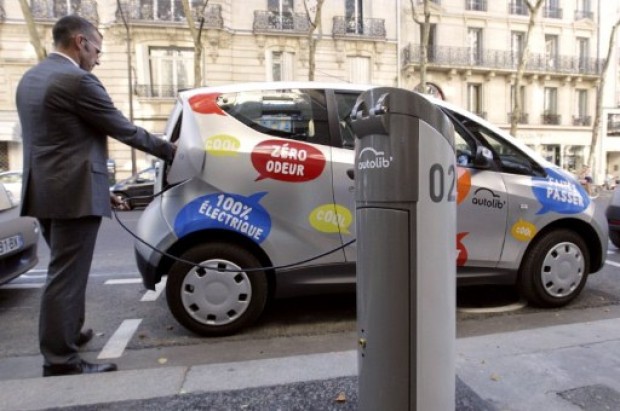
Anne Hildalgo (Mayor of Paris) stressed that reducing diesel engines and increasing the proportion of electric vehicles in the city was important not only to reduce carbon emissions, but also a matter of public health (because of particulate matter). Paris is supporting and encouraging manufacturers of city vehicles to produce electric and battery motors by teaming with over a dozen other European cities to use their contracting leverage. She also cited the Autolib carsharing program, which uses electric cars. “Don’t pit economics against public health.”
Autolib Electric Carshare and Charging Station. Photo: Yann Cramer
Christine St-Pierre (Minister of International Relations of Quebec), also talked about electric vehicles. Part of Quebec’s strategy is to have charging stations along highways, even to frequent destinations of Quebecois within the US. In addition, Quebec is partnering with California on a carbon exchange, and other states and provinces are interested in partnering as well.
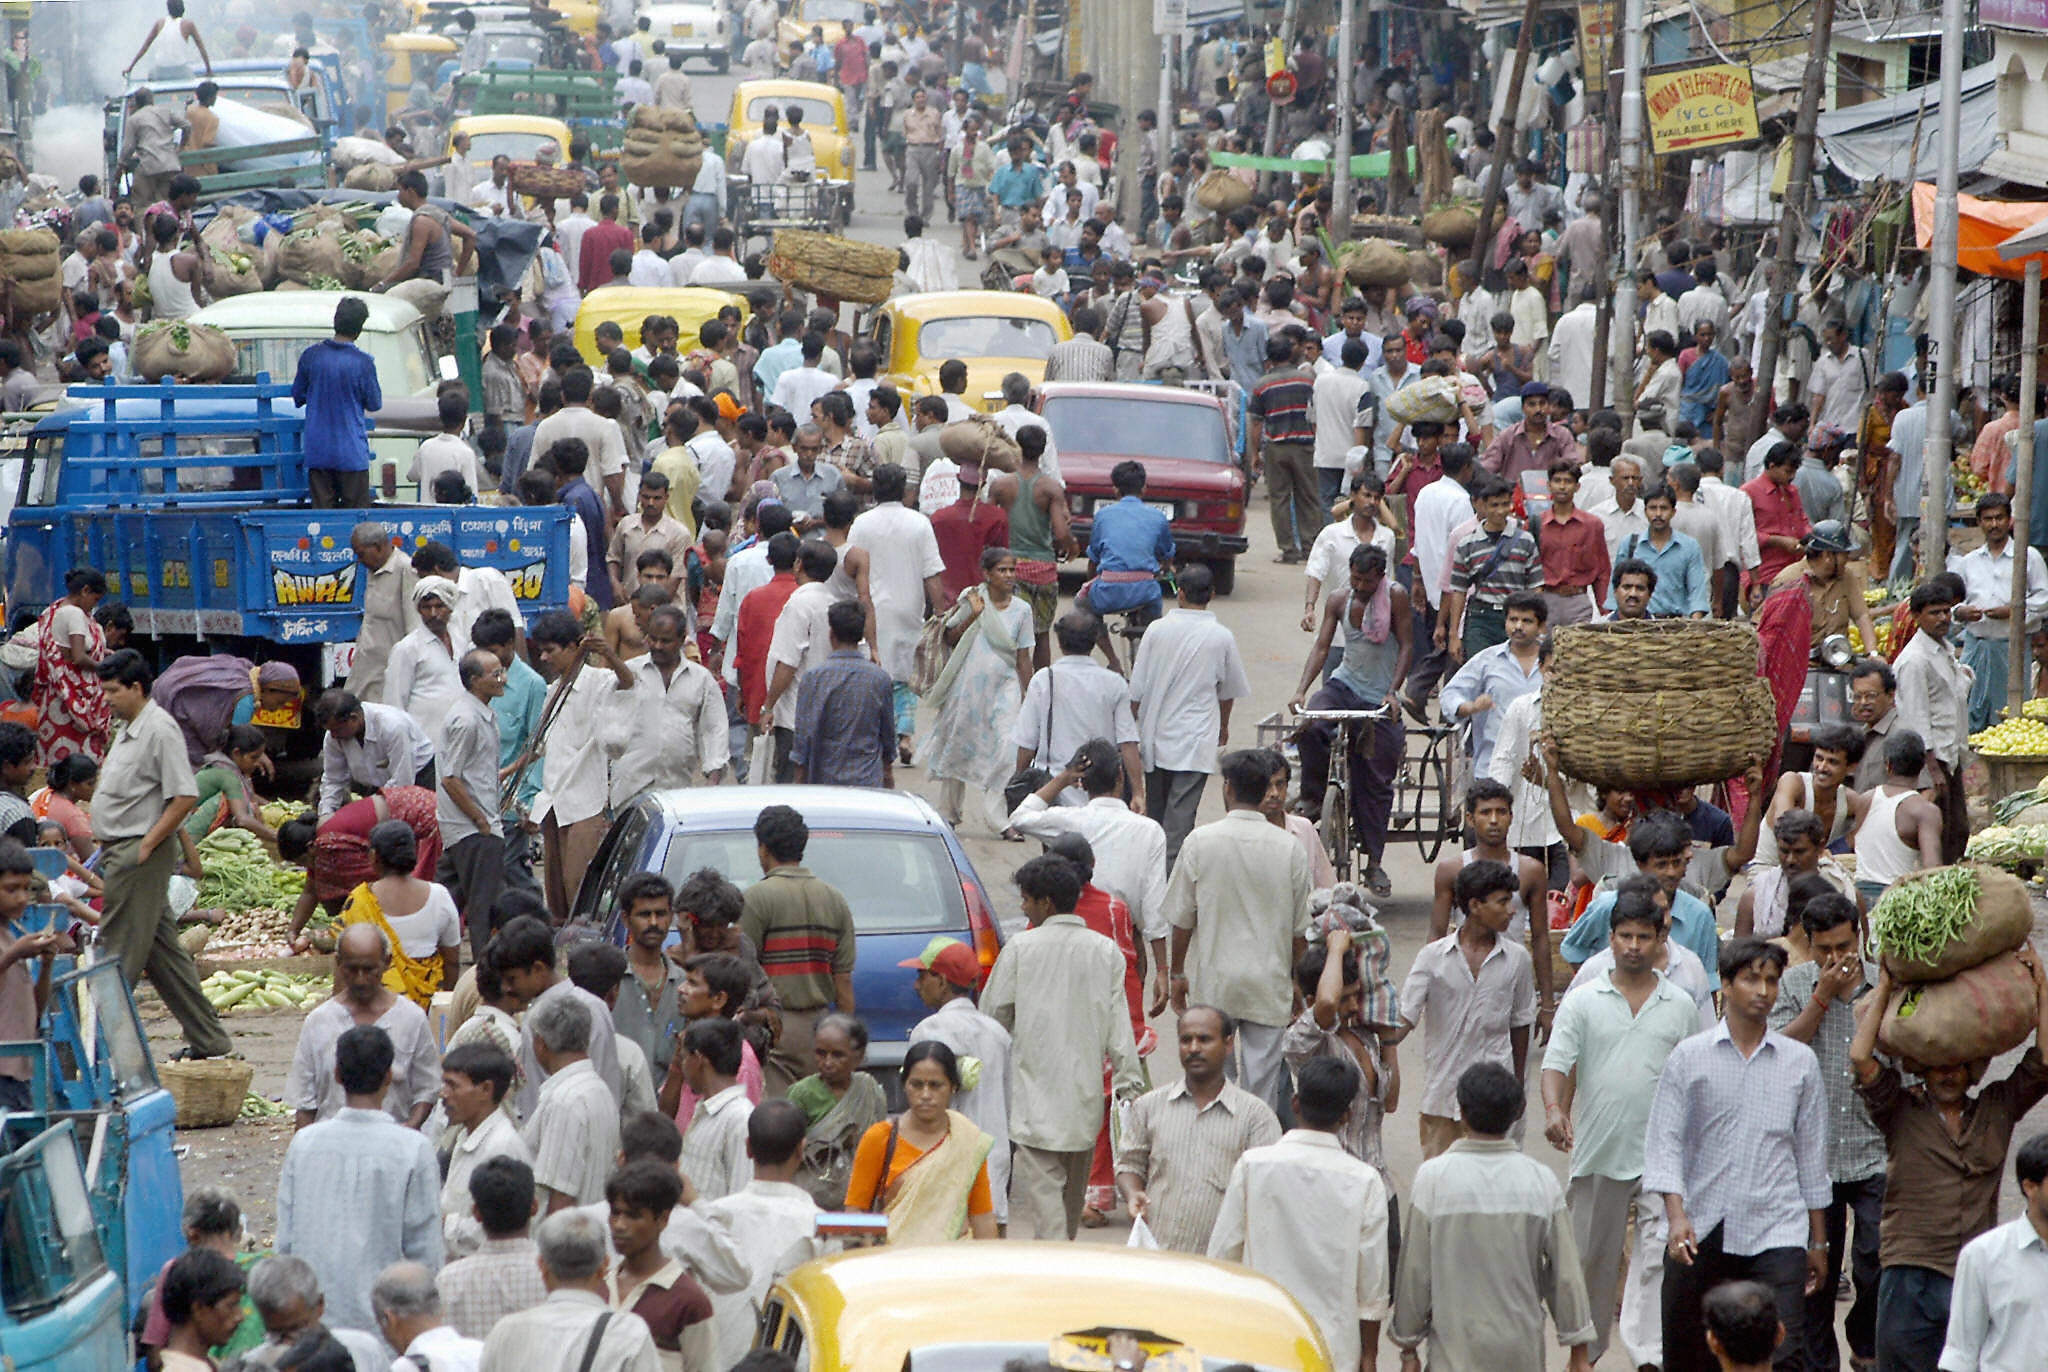
Sanjivi Sundar (Emeritus Professor in the Department of Policy Studies at TERI University in New Delhi) stated in India, 65% of trips are less than 5km, and up to 75% of those trips are made by non-motorized means. There are several steps India must take in order to increase mobility and reduce driving:
Strengthening non-motorized networks by making walking and biking safer, more convenient, and more comprehensive
Changing Transportation departments to mobility departments by eliminating modal silos so that they take real responsibility for transportation and carbon emissions.
Building up high-quality, low-cost bus and BRT transportation that can be implemented in the majority of cities quickly
Majority of trips in India are non-motorized. Photo: Ron Sutton
From a 100,000 foot level, many speakers brought up the re-thinking of freedom and mobility. Mobility means freedom of movement. Whereas in the 20th Century this meant the freedom to drive everywhere, society is rethinking what freedom of movement means, and by doing so rethinking the very notion of freedom. Vincent Kaufmann framed it in European terms, in that in much of Europe, freedom used to mean the freedom to drive, but now driving, to many, means a waste of time. Freedom is more often linked now to accessibility of destinations. The challenge, another speaker stated, is to keep the advantaged mobility of the car that people have grown accustomed to, but using cleaner, more efficient 21st century technology
Guillaume Pepy, Chairman of SNCF, closed the forum by talking about the optimism of the speakers and the audience. It is possible to manage growth in mobility without increasing carbon emissions, he said. In order to do this, the transportation sector needs cooperation from the energy sector so that electric mobility is not based on fossil fuels. This growth in mobility will depend a lot on the diversity of modes available to people, including shared mobility, non-motorized transportation, and driving. Managing this transportation diversity can be a starting point for cities to effectively use big data and to become smart cities to improve other services as well.
In all, the Forum reiterated the importance of sustainable transportation in long-term climate agreements. While rail has definite potential to promote and/or complement low-carbon city planning, it should not be forgotten that the construction of many rail systems can often result in large carbon emissions. An Asian Development Bank report summarizes several rail projects in Cairo, Bangalore, and Ho Chi Minh City. It found that the construction of the Cairo subway project may equal 28 years of operations emissions, due to fuel usage of construction vehicles and the embedded carbon content of primary construction materials. This should not be taken to mean that rail projects should not be built, for they undoubtedly can lead to longer-term low-carbon lifestyles. It should simply mean that other forms of transit should also be considered for certain situations, such as buses and BRT.


Recent Comments