This is an adaptation of sections of my final fellowship paper found here.

Ralph Buehler and John Pucher in their paper Demand for Public Transport in Germany and the USA: An Analysis of Rider Characteristics, have analyzed historical trends and events in transit in Germany and the US. Objectively speaking, Americans do not take many transit trips, on average. Between 2005 and 2010, the average American made 24 per year. In Germany that number was 139. (Figure 1) The US figure is lower than any other Western European country or Canada.

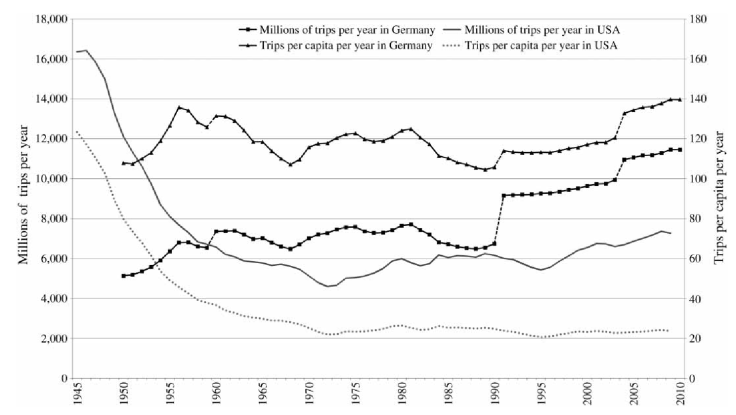
And while total number of trips in both countries has been rising in recent years, trips per capita have been rising consistently in Germany since the 1990s. In the US, they have stayed constant since the 1970s. (Figure 2)
So what happened? Between the 1940s and 1970s, transit use in the US dropped by 75% due to the ending of wartime rationing, increased automobile production, increasing incomes, and suburban sprawl. This drop was stopped by extensive support from all levels of government, averaging $23 billion per year (in 2010 dollars), which, despite a drop in the 1980s, continues today.
In Germany, most public transportation infrastructure was usable again by the early 1950s after being damaged in World War 2, and the combination of increased work trips, low automobile ownership, and cities crowded with ethnic Germans arriving from Eastern Europe kept transit ridership high. However, by the 1960s, car ownership tripled, sprawl grew on urban fringes, the federal highway network expanded, and cities widened roads and built parking garages. Subsidies in transit operating and capital costs raised ridership as in the US until the 1980s. The large spike in Figure 2 around 1991 represents the reunification; however the increase in ridership between 1991 and the early 2000s occurred almost exclusively in the former West, and offset heavy ridership losses in the former East. Since the early 2000s, ridership gains have been seen throughout Germany. These gains are partly due to a doubling of the gas tax (from $0.41/liter in 1990 to $0.88/liter in 2010), but also to better transit service (regional coordination, vehicles, information, etc.).
Germany and the US, as mentioned in the last article, both experienced high motorization rates and ridership declines. However, German authorities deliberately implemented policies to increase ridership. The US has not yet done so with such vigor.

Leave a comment